Tracking Celery Tasks with Signals
Track Celery tasks to capture user information, timing metrics, and contextual data for enhanced debugging and performance analysis.
In this post, I’ll share how I use Celery signals in Python to monitor tasks and make debugging easier. The focus is on two main goals:
Track timing metrics: Measure task execution time, queue wait time, and total time to gain performance insights and identify improvements.
Enrich and correlate task logs: Attach contextual data like user details and request IDs to tasks, binding this metadata to all logs for improved traceability and debugging.
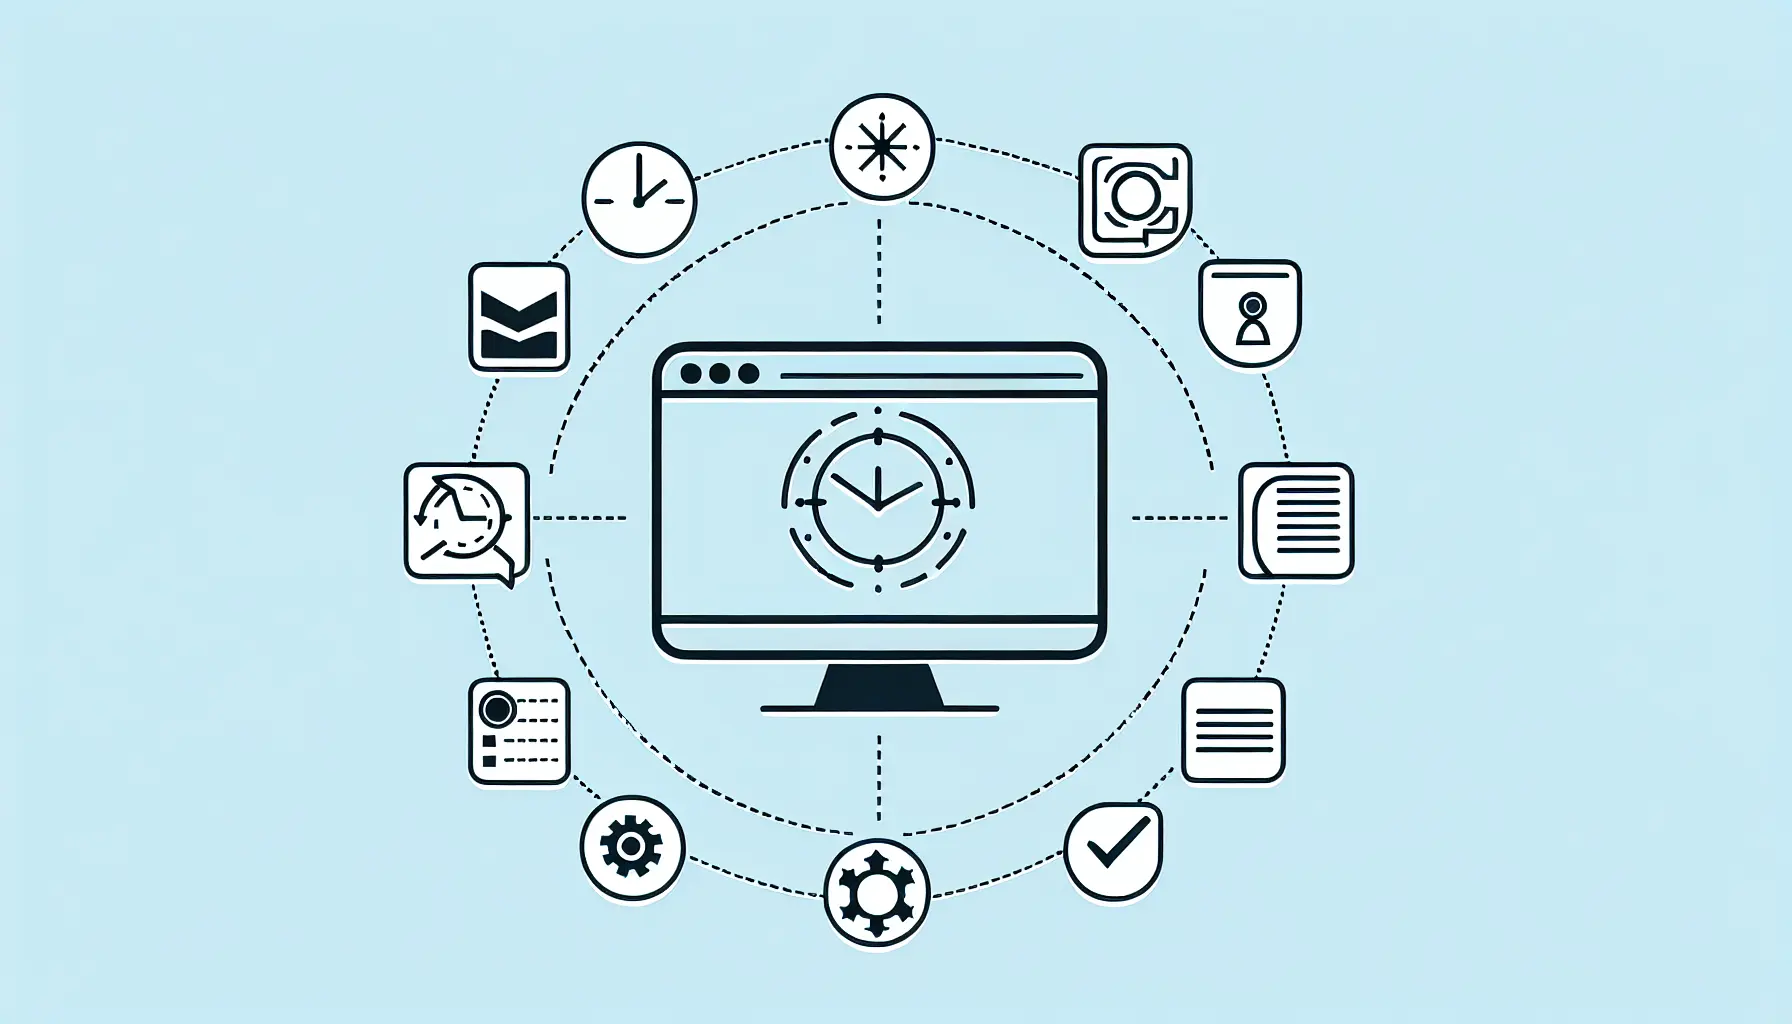
Understanding Celery Signals
Celery signals are a mechanism that lets applications listen for specific events during a task’s lifecycle, such as when a task is dispatched, starts, or completes. They allow you to attach custom logic to these events, enabling actions like logging metadata or tracking performance without tightly coupling your code.
We will use these signals to capture task metrics and contextual data for better observability and debugging.
Adding Metadata at Task Dispatch
The before_task_publish signal is triggered just before a task is sent to the message broker. let’s use it to attach metadata, such as user information, request ID, queue name, and dispatch timestamp, to the task headers.
1
2
3
4
5
6
7
8
9
10
11
12
13
14
15
16
17
18
19
20
21
22
23
24
25
import time
from celery import signals
import structlog

logger = structlog.get_logger()

@signals.before_task_publish.connect
def before_task_publish_handler(headers: dict, **kwargs: dict):
    # Replace with your application's logic to fetch request_id and user_info or add other info
    request_id = "your_request_id"
    user_info = {"user_id": "<user_id>", "org_id": "<org_id>"}

    headers["request_id"] = request_id
    headers["user_info"] = user_info
    headers["publish_time"] = time.time()

    logger.info(
        "Celery event",
        state="before_task_publish",
        task_id=headers.get("id"),
        task_name=headers.get("task"),
        request_id=request_id,
        queue_name=kwargs.get("routing_key"),
        **user_info,
    )
Capturing Task Start Time and Context
The task_prerun signal is triggered just before a task begins execution on a worker. Let’s use it to record the task’s start time and bind contextual data (like task_id and request_id) to the structlog contextvars. This ensures all logs generated during task execution are correlated with this metadata, improving traceability.
1
2
3
4
5
6
7
8
9
10
11
12
13
14
15
16
17
18
19
20
21
22
23
24
25
26
27
import time

from celery import signals, Task
import structlog

@signals.task_prerun.connect
def on_task_prerun(task_id: str, task: Task, **kwargs):
    task.request.prerun_time = time.time()  # Record task start time
    request_id = getattr(task.request, "request_id", None)
    queue_name = task.request.get("delivery_info", {}).get("routing_key")
    user_info = getattr(task.request, "user_info", {})

    # Bind task_id and request_id to structlog context for log correlation
    structlog.contextvars.bind_contextvars(
        request_id=request_id,
        task_id=task_id,
    )

    logger.info(
        "Celery event",
        state="task_prerun",
        task_id=task_id,
        task_name=task.name,
        request_id=request_id,
        queue_name=queue_name,
        **user_info,
    )
Calculating Metrics After Task Completion
The task_postrun signal is triggered after a task completes, whether it succeeds or fails. Here, we calculate key metrics: queue wait time (time spent in the queue before execution), execution time (time spent running the task), and total time (from dispatch to completion). These metrics help identify bottlenecks and optimize task performance.
1
2
3
4
5
6
7
8
9
10
11
12
13
14
15
16
17
18
19
20
21
22
23
24
25
26
27
28
29
30
31
32
33
34
import time

from celery import Task

@signals.task_postrun.connect
def on_task_postrun(task_id: str, task: Task, state: str, **kwargs: dict):
    current_time = time.time()

    user_info = getattr(task.request, "user_info", {})
    request_id = getattr(task.request, "request_id", "")
    queue_name = task.request.get("delivery_info", {}).get("routing_key")

    # Calculate timing metrics
    total_time = current_time - task.request.publish_time if hasattr(task.request, "publish_time") else None
    execution_time = current_time - task.request.prerun_time if hasattr(task.request, "prerun_time") else None
    queue_wait_time = (
        task.request.prerun_time - task.request.publish_time
        if hasattr(task.request, "publish_time") and hasattr(task.request, "prerun_time")
        else None
    )

    logger.info(
        "Celery event",
        state="task_postrun",
        task_id=task_id,
        task_name=task.name,
        request_id=request_id,
        queue_name=queue_name,
        queue_wait_time=queue_wait_time,
        total_time=total_time,
        execution_time=execution_time,
        result=state,
        **user_info,
    )
Now, you’ll receive timing logs for each task after its completion, along with important details like the request ID and user information. Additionally, task logs are linked with the request_id and task_id, ensuring better traceability and easier debugging. 🎉