Enriching Kubernetes Ingress Logs with Better User and Request Insights
Adding user identity and essential request details for improved monitoring in controller logs

In this blog, I’m going to walk you through how to enrich your Ingress-Nginx Controller logs with valuable information about the users making request to your API and other important details, such as how long each request spends waiting, processing, and more. This helps you debug faster and get clearer insights into your traffic patterns all without needing expensive monitoring tools.
Since the Ingress acts as the main gateway to the cluster, logging those info here gives you a centralized view of all incoming requests.
Add required info on response headers in your application
The first step is to have your application send essential user info like X-User-ID, X-Org-ID, and X-User-Email as response headers. This enables the ingress to include these details in the logs. Because the way to set these headers varies widely depending on the programming language and framework, I won’t go into those specifics here.
Besides these user headers, here are some additional headers I like to add to improve observability and make logs more meaningful. Feel free to include any of these in your app responses if they make sense for your use case:
X-Pod-Name: The name of the pod handling the request. It usually comes from the
HOSTNAMEenvironment variable in the application pod.X-Queue-Wait-Time: This is the time a request spends waiting in the queue. For this, we need to send a header (for example,
X-Request-Start) to the app that shows when the request first arrived at the ingress. The app can then subtract this time from when it starts processing the request to figure out how long the request waited. I’ll explain how to send this header to the upstream application in the next step.X-Process-Time: The actual time took to process the request without any queue time.
X-Original-Route: The original route pattern of the endpoint, like
api/folder/<folder_id>, instead of the full resolved path with IDs or params likeapi/folder/25b95bea0d5a43919f36ac428c15f04f?page=2&limit=20. This helps to make the logs easier to analyze and aggregate.
Sending “X-Request-Start” header to the upstream
To send the X-Request-Start header to the upstream for calculating the queue wait time, create a ConfigMap:
1
2
3
4
5
6
7
apiVersion: v1
kind: ConfigMap
metadata:
  name: custom-headers
  namespace: ingress-nginx
data:
  X-Request-Start: $msec
Then, in the Ingress NGINX ConfigMap, set the proxy-set-headers field to reference the above ConfigMap:
1
2
data:
  proxy-set-headers: ingress-nginx/custom-headers
This sets the X-Request-Start header to the current timestamp and send to the upstream application.
Configure Ingress to to log the headers
Next, update the controller configMap to log your custom headers so they appear in the ingress logs.
To reference a response header in the log format, use the variable $upstream_<header_name>, where <header_name> is the lowercase request header name with dashes (-) replaced by underscores (_). For example, the response header X-User-ID becomes $http_x_user_id.
See the NGINX Ingress log-format documentation for the full list of available variables and examples.
1
2
3
4
5
6
7
8
apiVersion: v1
kind: ConfigMap
metadata:
  name: nginx-ingress-controller
  namespace: ingress-nginx
data:
  log-format-escape-json: "true"
  log-format-upstream: '{<others>, "request_id":"$req_id", "remote_addr":"$remote_addr", "user_id":"$upstream_http_x_user_id","org_id":"$upstream_http_x_org_id"}'
Hide the headers from client responses
To prevent these headers from being sent to clients, list them under hide-headers in the Ingress ConfigMap.
1
2
data:
  hide-headers: X-User-Id, X-Org-Id, X-User-Email, X-Original-Route, X-Queue-Wait-Time, X-Process-Time, X-Pod-Name
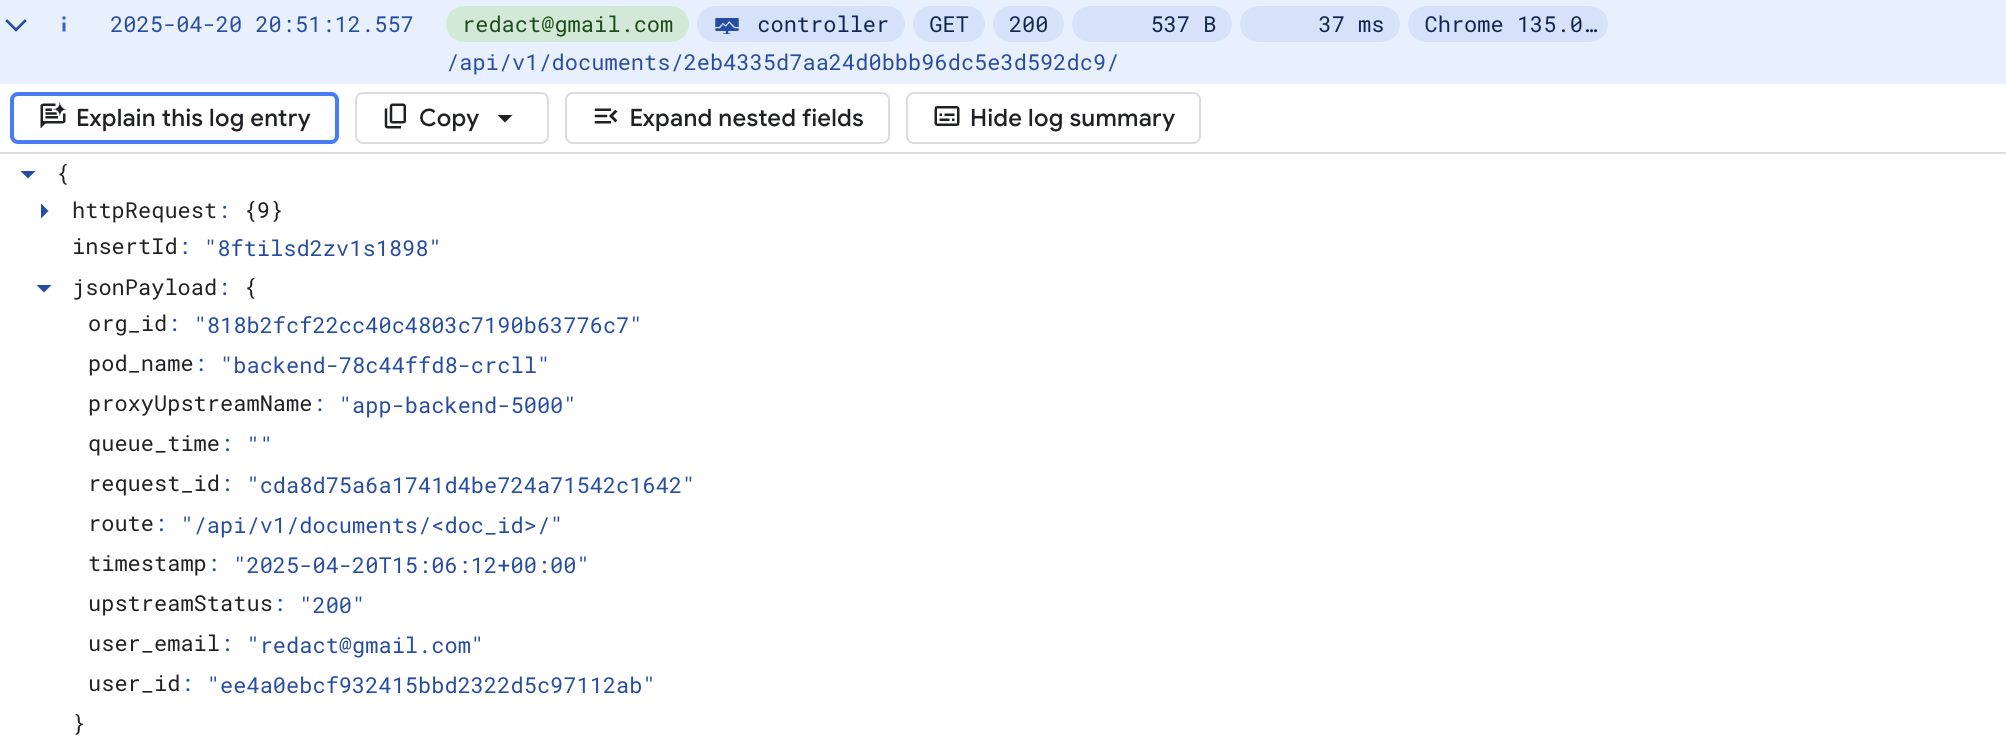
Wrapping up
🎉 Now the ingress logs should contain information like user identity and request details. You can also create custom metrics and dashboards using tools like Google Cloud Metrics and Dashboards.